
Participants looking to optimise their model solar car must understand how the mandatory 2000 cm³ rectangular prism is going to impact the performance of their vehicle. Not only must the prism be kept as light weight as possible but you need to consider its aerodynamic profile. The dimensions that you choose are ultimately going to determine the size, shape and maximum possible top speed of your car.
Let’s for a moment assume your solar car is travelling in a straight line on an endless flat and smooth piece of track. If we cancel out our vertical gravity and normal forces then this reduces the force diagram to as follows:
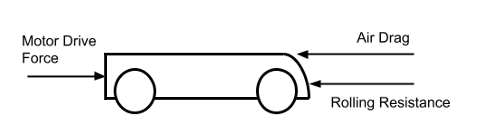
Once the car hits top speed these forces balance out and the system reaches a state of equilibrium. In other words, the air drag and rolling resistance have combined to match and oppose your drive force. The car can’t go any faster unless you’re able to lower the air drag or rolling resistance (or both).
How these two forces combine will depend on how much power is coming from your solar panel (sun level), how light your car is, how efficient your drive system is, how easily the car rolls and how streamline your design is.
Rolling resistance only really changes with car weight and is independent of its speed. Your wheels should already have a very low rolling resistance so there’s little you can do to improve it other than to keep your car as light as possible.
Air drag is however proportional to the square of your car velocity. Every small increase in speed means much more drag force. In fact, air drag generally accounts for more than 80% of the total drag force when a model solar car is racing in full sun conditions.
If you want your car to reach the highest possible top speed then you need to decrease the air drag as much as possible.
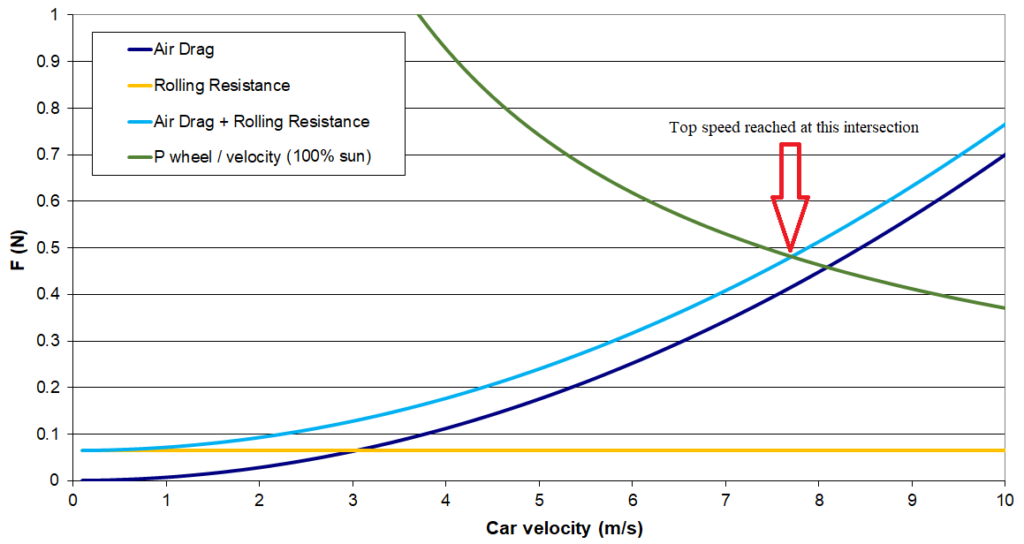
The plot above shows some typical force curves of a good model solar car with a 6W solar panel. Actual real-world top speeds will be somewhat less due to track misalignments and increased drag around the track corners (both extra rolling resistance from the guide rollers and steering drag of the wheels themselves).
Air Drag
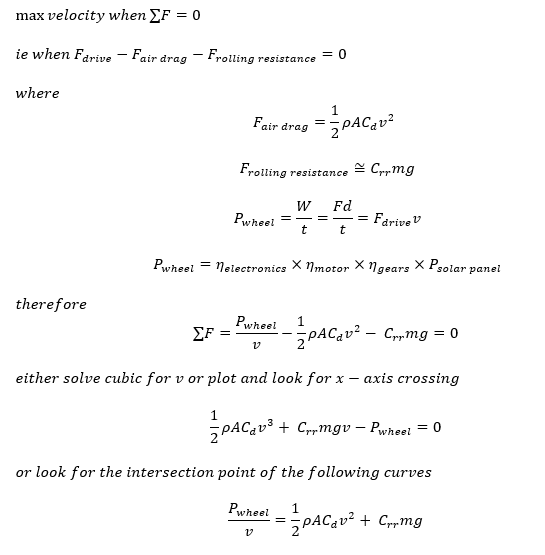
As seen above, the Drag Force Equation is given by:
Drag Force = 0.5 × Air Density × Frontal Area (A) × Drag Coefficient (Cd) × Velocity²
The density of air around our racetrack isn’t going to change so that leaves you to manage the frontal area/cross-section (A) and shape of the car (Cd).
Frontal/Cross-sectional Area (A)
Since the 2026 regulations dictate a fixed volume of 2000 cm³ rather than fixed dimensions this gives you considerable control over the cross-section. Your goal should be to try and keep the frontal profile of your box down as much as is reasonably possible. If you cut the cross-sectional area in half then you’ll halve the aerodynamic drag force pushing against the car.
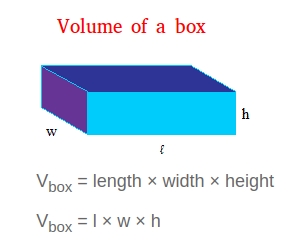
The absolute worst layout for your prism would be to go for something that extends right out to the maximum height and width limit of the regulations (15cm high and 32cm wide). You’ll actually want at least 2cm under the car to clear the guide channel so let’s reduce this slightly to 13cm high x 32cm wide (416 sq cm). This gives you a huge frontal area.
Conversely, the smallest possible frontal area is something that extends out to the maximum car length in the regulations (50cm long). Doing a quick calculation 2000cm3 / 50cm = 40cm2. This is approximately 1/10th of the frontal area and so 1/10th of the air drag.
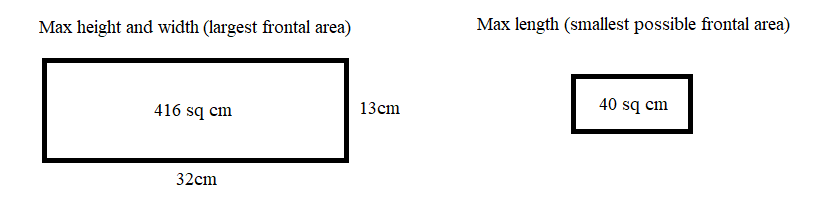
In reality you’ll likely need to go for something that’s somewhere in between since you’ll still need to incorporate a seat for your manakin driver and also leave space in front and behind your prism for streamlining. You’ll also need to think about how to arrange your frontal area (height and width). A narrow but high area will likely raise the car’s centre of gravity compared with the same area that’s lower and wider.
Drag Coefficient (Cd)
The shape of your solar car (Cd) is arguably going to be even more important than the frontal area. Below are some examples of drag coefficients for a flat plate, circle/rod and airfoil, all with the same width. The airfoil has 2.0 / 0.12 = 16.66 times less drag.
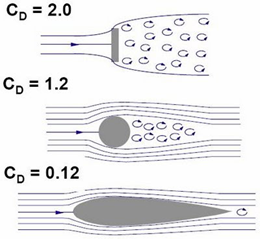
If you were to fit the previous prism with the 416cm2 frontal area inside an airfoil then it would actually have less drag than the prism with the small 40cm2 frontal area.
Keep in mind that these are standalone shapes with uninterrupted airflow. Model solar cars usually have wheels, guide rollers, motors, solar panels, etc. attached outside of the body which all disrupt the airflow, create unwanted turbulence and increase air drag. This results in a narrowing of the gap between two cars with good and bad streamlining. As an example, the two cars pictured below have the same cross-sectional area. Wind tunnel tests carried out on both found the Cd of the airfoil car to be approximately only 1/3rd of the box car on the left. This is still a big difference but somewhat less than if the simple shapes from above were considered on their own.
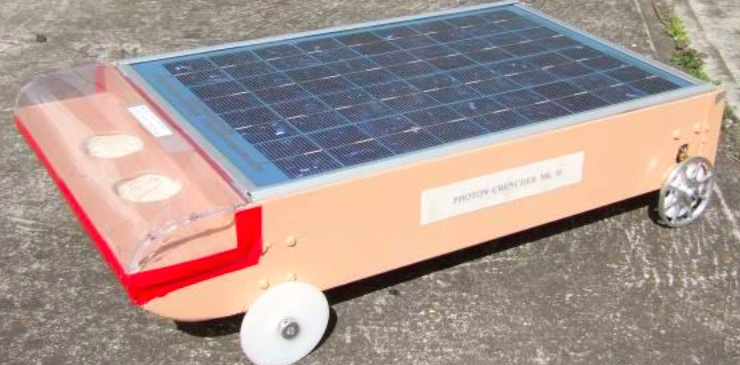
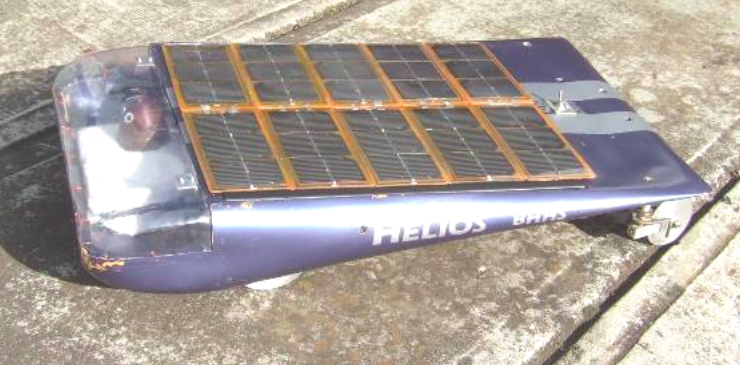
You can have a look at what kind of difference this makes to a 100m race time by downloading and checking out the MS Excel solar car simulator from the TMSC kits page. You’ll need to select an air drag coefficient of 0.012 for the above box car on the left and then also try 0.004 for the airfoil car on the right (these are not your standard Cd values that you’d see online but rather a coefficient that combines the 1/2 x ρ x Cd x A all into one). You should find the difference in race time to be more than 2 whole seconds at 100% sun.
If you’re interested in seeing some other examples of model solar cars that have had their drag coefficient measured in a wind tunnel then head down to page 29 of the following simulator document:
www.tassolarchallenge.org/wp-content/uploads/2026/08/Simulator-Instructions-and-Coefficients.pdf
So if you want to build a winning solar car then the answer is pretty clear. You need to work on both limiting your frontal area while also paying close attention to the streamlining of your car. You can either house your prism inside a shell/body or have it make up a part of the body with bits coming off the front and rear of the prism to improve its aerodynamic shape. Just remember that the prism needs to be easily removeable from the car so organisers can pick it up and make some quick measurements to verify the 2000cm3 volume.
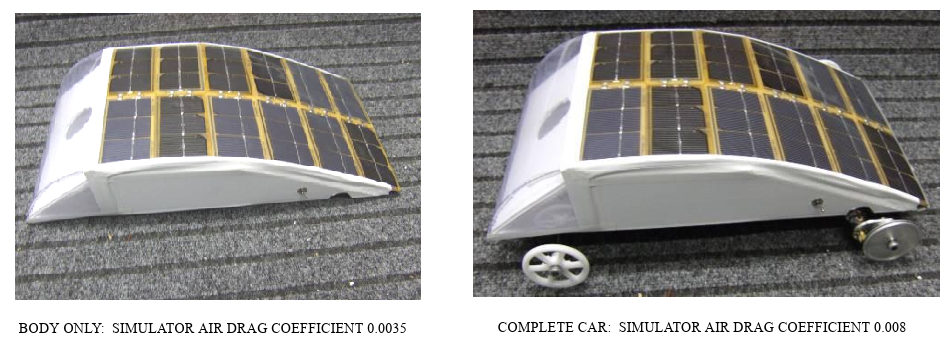
One final area of consideration when working out your car’s frontal area and shape (just to complicate things a bit further). The last 2 pages of the above pdf show some actual wind tunnel test results of a car body vs the complete car (see below). In this particular example the rolling chassis more than doubles the air drag. Does this mean you need to look at enclosing all the wheels and motor inside the body? Possibly. Or maybe if you have a streamlined body with a small cross-section down the middle and wheels out wide then this will be better overall? We’ll leave this up to you to decide but whatever you go with you should always try to keep as much of your chassis within the body as possible. Simply attaching a body to the top of a rolling chassis is easy and can still give very good results but if you want to take your design to the next level then you need to start looking at every small aerodynamic advantage.
If you’re going to have a look at any actual, real-world vehicles for inspiration then it’s recommended that you check out some of the entries from the World Solar Challenge, the Shell Eco Marathon or top Human Powered Vehicle events. These are all designed for ultra low air drag since the power or energy they’re running on is so limited. You may not be able to produce a model solar car with such clean compound curves but these are the kind of basic shapes you should be looking at.
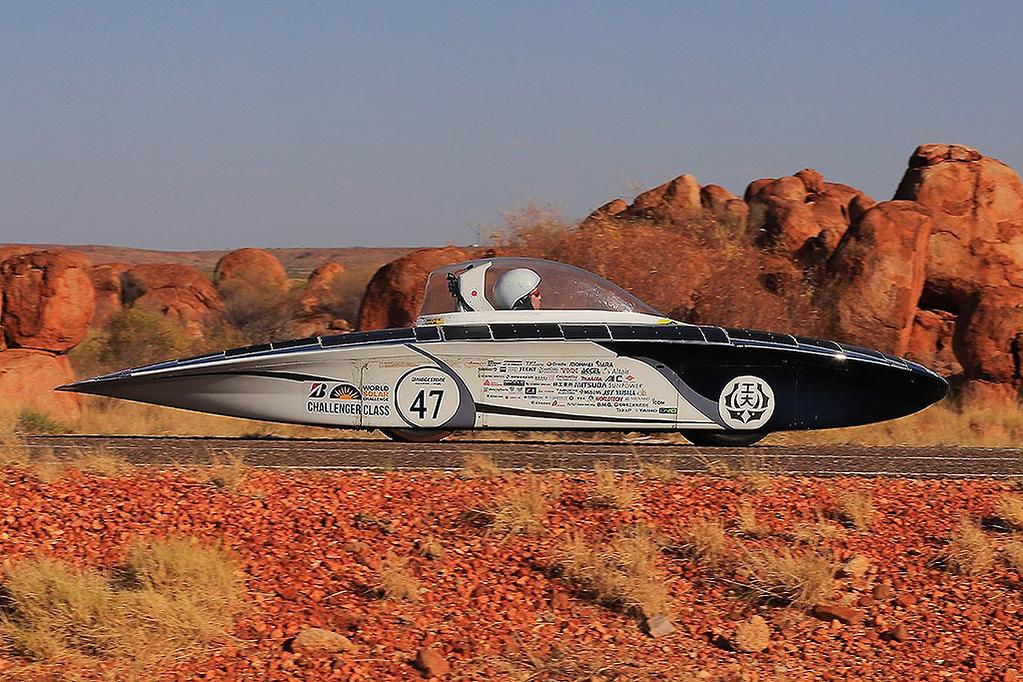
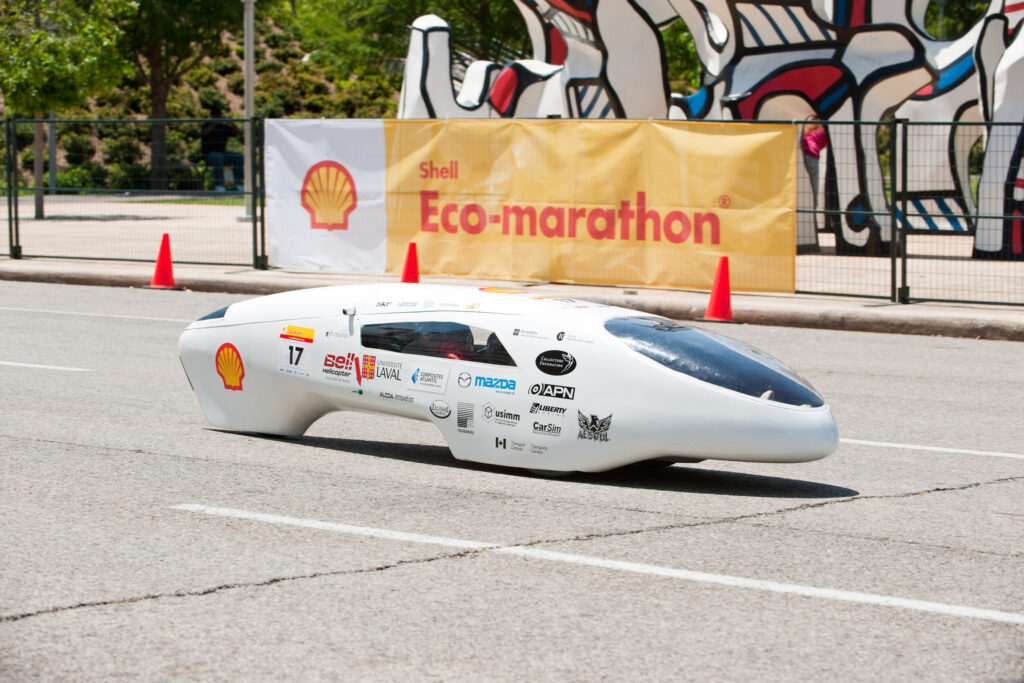

An entry from the World Solar Challenge running from Darwin to Adelaide (above left). The mileage record at the Shell Eco Marathon is over 1000km/litre of fuel (above centre). The speed world record of a purely human powered vehicle is over 140km/hr (above right).
Standard road cars are in comparison designed to be practical, spacious and safe. Running on either fossil fuel or electric battery power their motors offer vastly greater amounts of power to overcome their much less aerodynamic profile. F1 cars, while trying to minimise air drag, reach incredibly high speeds and so also need to be designed with downforce and traction in mind. All those little wings and flaps are generally going to increase the air drag but they instead gain the necessary traction to get around the race track as quickly as possible.
While not F1, here’s an example clip of what can happen at high speeds if the air isn’t flowing around a race car as intended. The much slower speeds of model solar cars mean we don’t need to design for downforce and can purely focus on minimising air drag.